|
<< Click to Display Table of Contents >> Model Application |
  
|
|
<< Click to Display Table of Contents >> Model Application |
|
Model applications include application, R Data and R Drawing.
❖Score
Apply the trained model to new data. There must be two input nodes of scoring node: the one is model node and the other is data node. The data set node should contain fields with the same column name and type with that used in the model.
The scoring node connects a model node and a data set node. Selected scoring node setting and display area contains three pages: Metadata, Filter Data and Explore data.
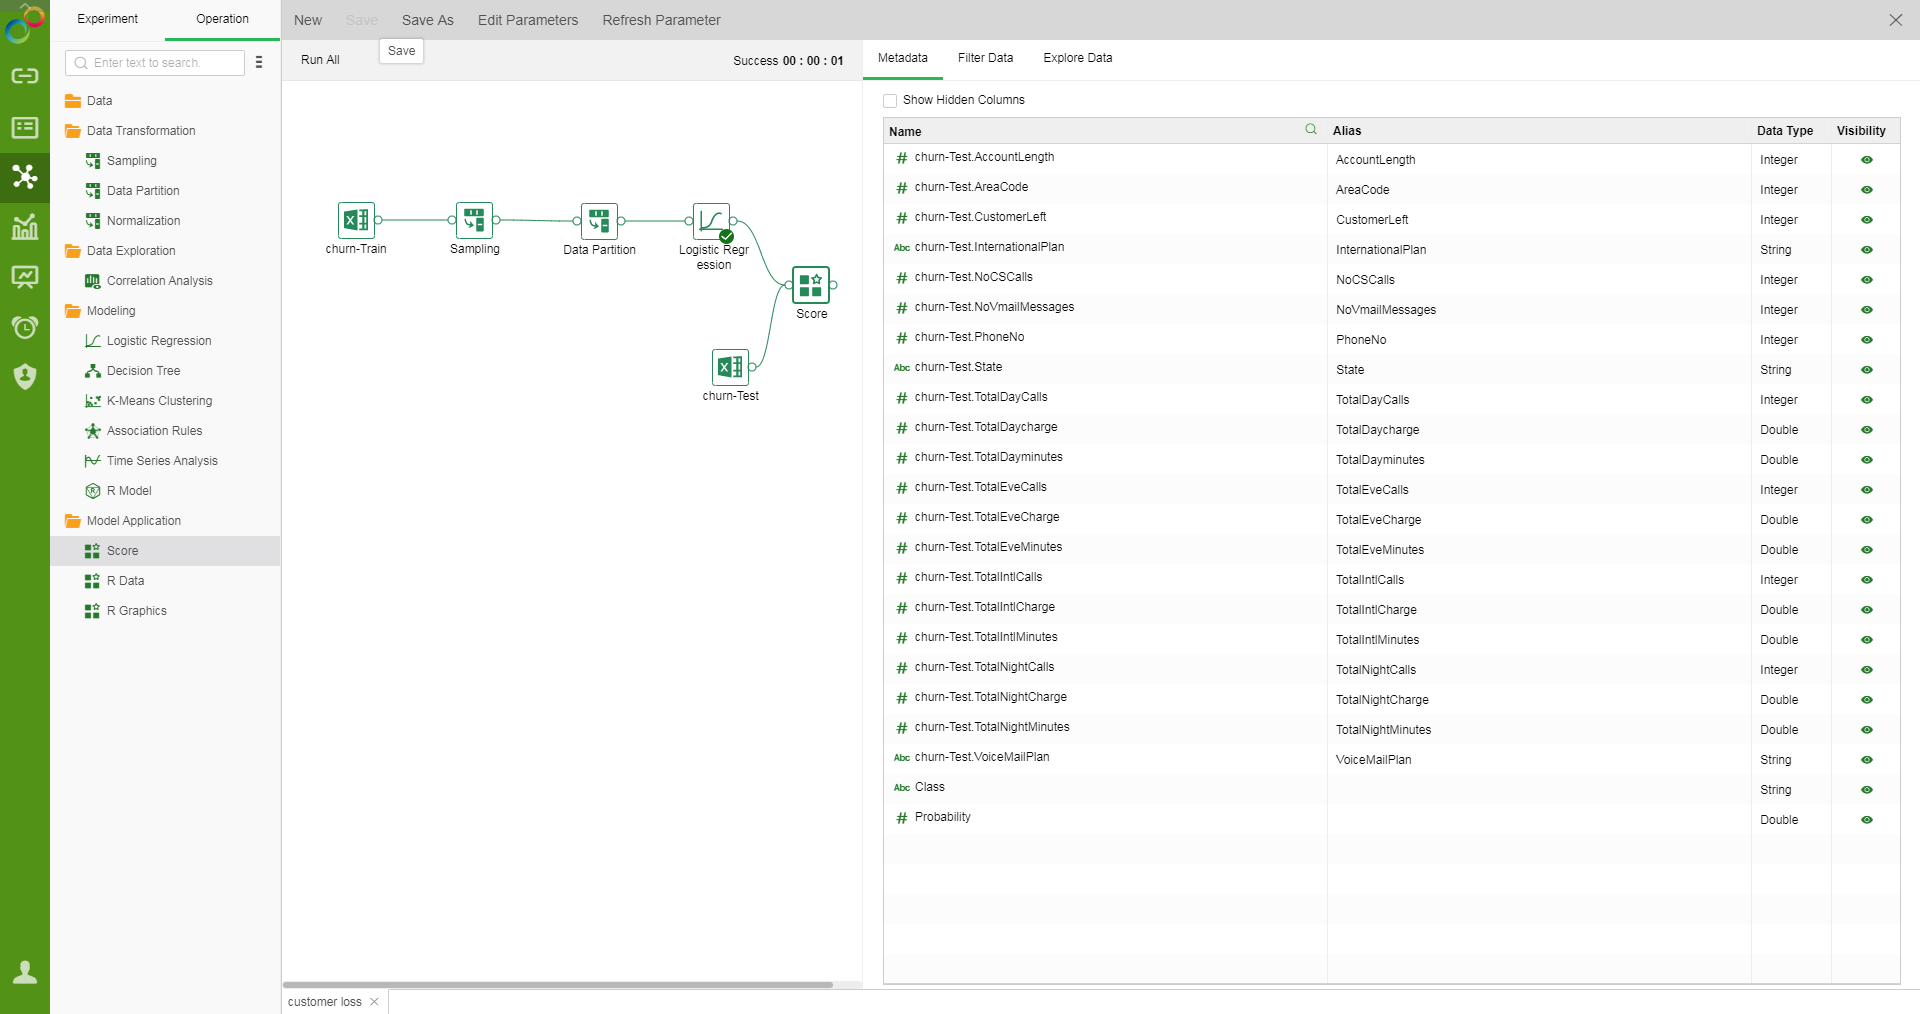
oMetadata
See Data for details
oFilter Data
See Data for details
oExplore Data
See Data for details
❖R Data
The "R Data" node can only connect to the "R Model" node. The input script represents the data of an R model in the form of a table.
Connect an R model node. Input the script and select "R Data." The display area contains four tab pages, namely "Parameter Configuration", "Metadata", "Filter Data", and "Explore Data."
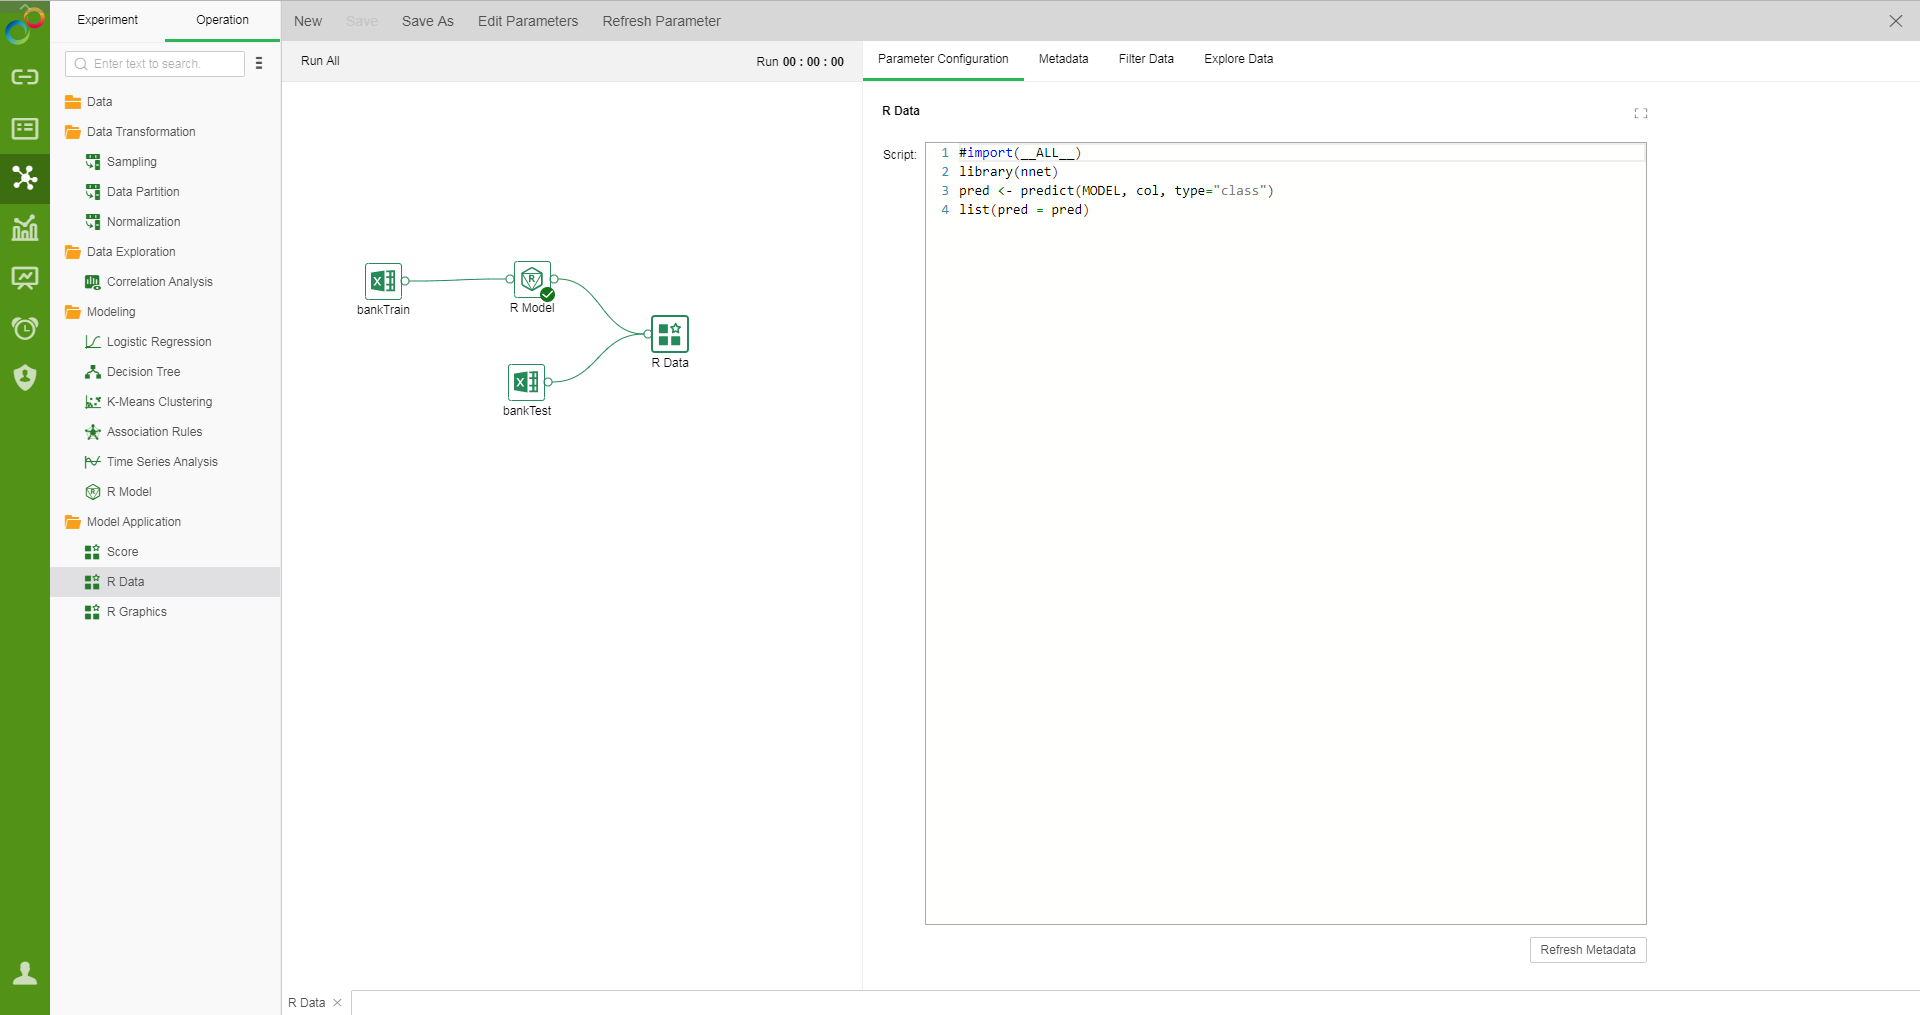
oParameter Configuration
R data can directly reference MODEL variables. The value of corresponding column in a data set can be imported via col[[“xxx”]] where xxx is a column name; the parameter value can be imported via param[[“xxx”]] where xxx is a parameter name. For custom scripts, R takes the finally executed code line results as the returned value. Yonghong Z-Suite requires that the returned value must be a list object containing several returned value columns. For example, list(out1=a, out2=b), where out1, out2 are the names of returned value columns and a and b are values of corresponding returned value columns. They can be a constant or vector.
oMetadata
See Data for details
oFilter Data
See Data for details
oExploration Data
See Data for details
❖R Graphics
The "R Graphics" node can only connect to the "R Model" node. The input script represents the data of an R model in the form of a graphic.
Connect an R model node. Input the script and select "R Graphics." The display area contains two tab pages, namely "Parameter Configuration" and "Result."
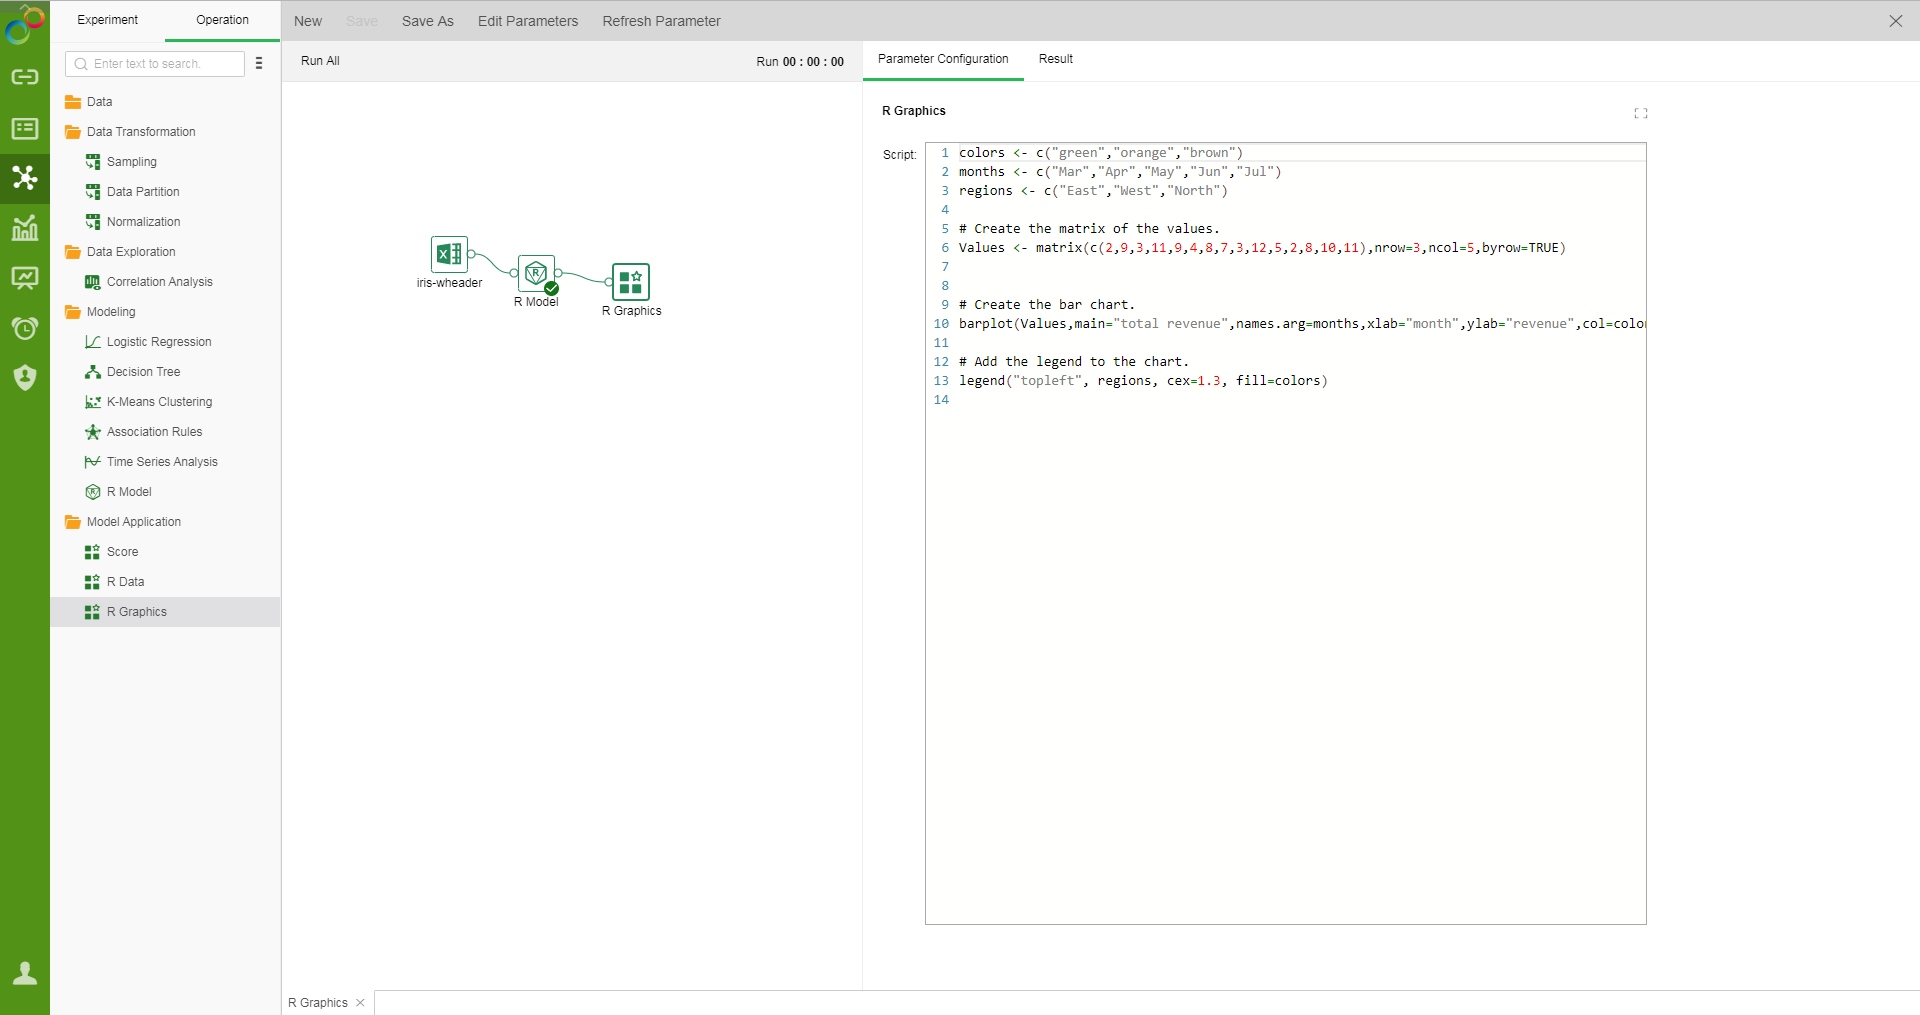
oParameter Configuration
Input script to reference an R model. R graphics can directly reference MODEL variables. and can reference R Scripts for Drawing.
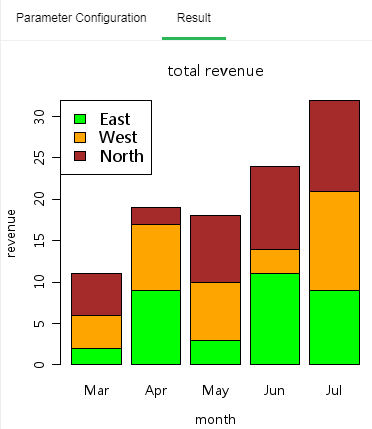
oResult
The result of R model is shown in the form of a graphic.