|
<< Click to Display Table of Contents >> Calculator Script |
  
|
|
<< Click to Display Table of Contents >> Calculator Script |
|
In the open dashboard, the user can create a data segment through a script that is only applicable to the current dashboard and not to other dashboards. The user data segment includes a new expression and a new aggregate expression.
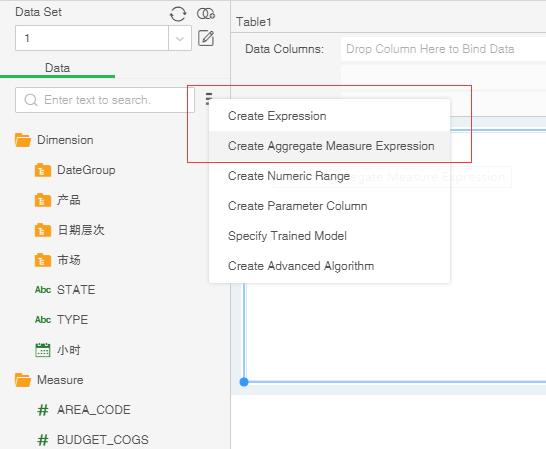
Open the binding interface of any component, that is, open the query list, click the More button in the query list, you can select the type of data segment you want to create, as shown in the following figure.
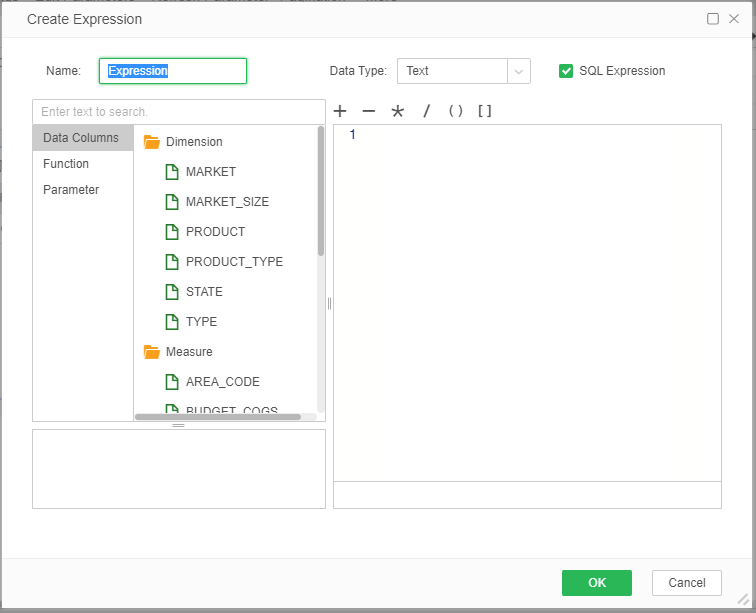
When the user selects one of the expressions, the dialog opens, as shown in the following image.
[Name] Set the name of the data segment.
[Data Type] Set the type of data segment.
[SQL Expression] When the user selects this item, the SQL statement is supported. When a new aggregation expression is created, this option is grayed out and cannot be checked.
Basic syntax: A function consists of a function name and parentheses, such as Sum(). The data consists of the field name and col[''], such as col['sales']. Computed fields also support calculation of symbols such as addition, subtraction, multiplication, and division.
Users can use functions provided in the Utilities folder. The usage of each function is described in detail in theTop Level Scope Function.
➢Notes: Expressions cannot use the aggregate functions provided in the Aggregation folder. Only aggregate expressions can be used.
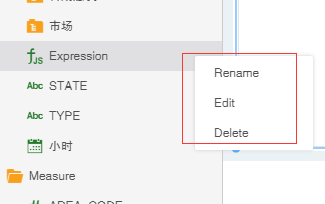
When the user needs to edit, rename, and remove again after creating a data segment, the user can select this data segment and then right-click the corresponding tab.
❖Expression
When the user needs to create a data segment as a dimension for statistics, or if you need to modify the data in a data segment, you can choose to create a new expression.
When the data type of an expression is a non-numeric type (such as text, boolean, date, etc.), it is stored in the dimension directory by default and cannot be dragged to the metric directory; the data type is numeric (such as numeric value, single-precision floating-point number, etc.) By default, it is stored in the metrics directory and cannot be dragged to the dimension directory.
The user can set the name of the data segment, the data type of the data segment, and write a script in the calculator dialog box of the opened expression to realize the creation of the data segment. Aggregate functions cannot be used in scripts.
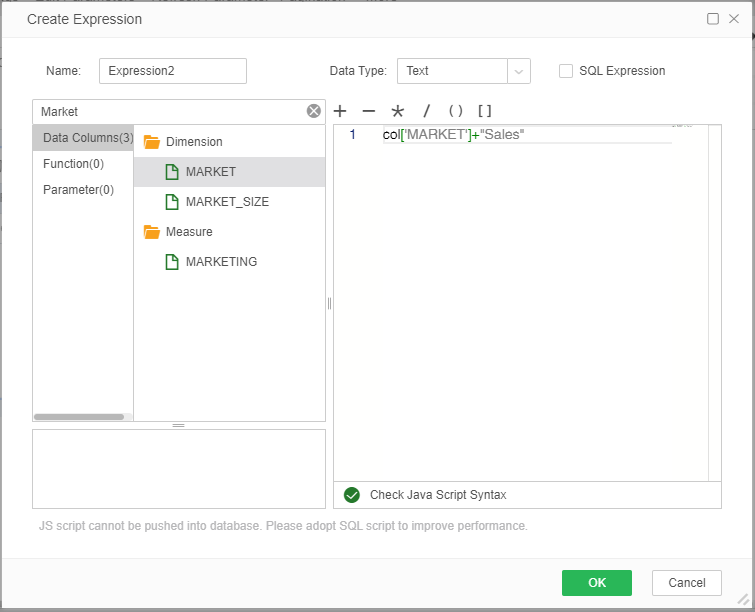
➢For Example1
Suppose there is a dimension data segment market "MARKET". When the user needs to add the suffix "sales situation" to each market, it can be realized by the calculator of the expression, just click the corresponding column, such as: "MARKET" and then Then add "+ sales situation" as shown below.
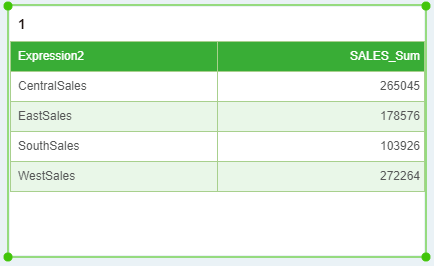
As shown in the following table, the market sales data segment is implemented by an expression of a new text type.
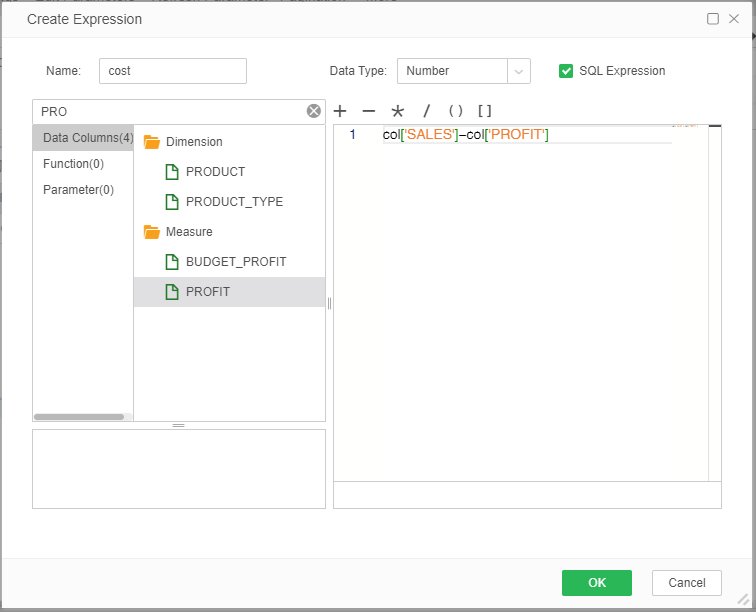
➢For Example2
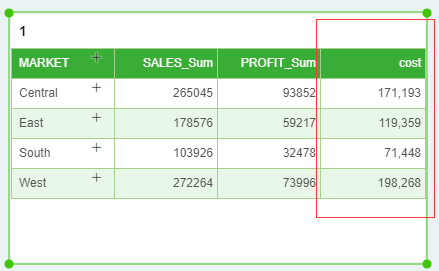
Suppose there are two data segments, one is the sales "SALES" and the other is the profit "PROFIT". When the user wants to calculate the cost, it can be realized by the calculator of the expression. The content of the script is between the two data segments. The difference, the new expression is shown below.
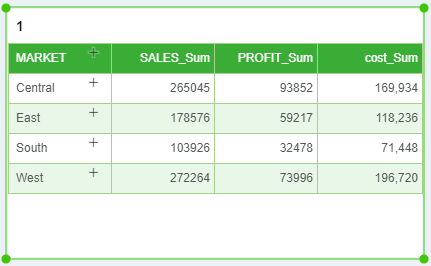
As shown in the following table, the cost data segment is implemented by creating a new numeric type expression.
❖Aggregate expressions
When the user needs to summarize the data in a data segment, a new aggregation expression can be created. Aggregate expressions are stored by default in the metrics directory and cannot be dragged to the dimension directory. The user can set the name of the data segment, the data type of the data segment, and write a script in the opened aggregate expression dialog box to implement the creation of the metric data segment. The data type is preferably a numeric type, suitable for metrics, and aggregate functions can be used in scripts.
Aggregate expressions can only be bound in components of the output type (text, table, crosstab, chart, gauge) and the component is in an aggregated state.
➢For Example
Suppose there are three data segments, total monthly sales "SLAES", monthly profit "PROFIT", and market "MARKET". When the user wants to calculate the cost of each region, it can be realized by the aggregation expression. The content of the script is the difference between the sum of the two data segments, as shown in the following figure.
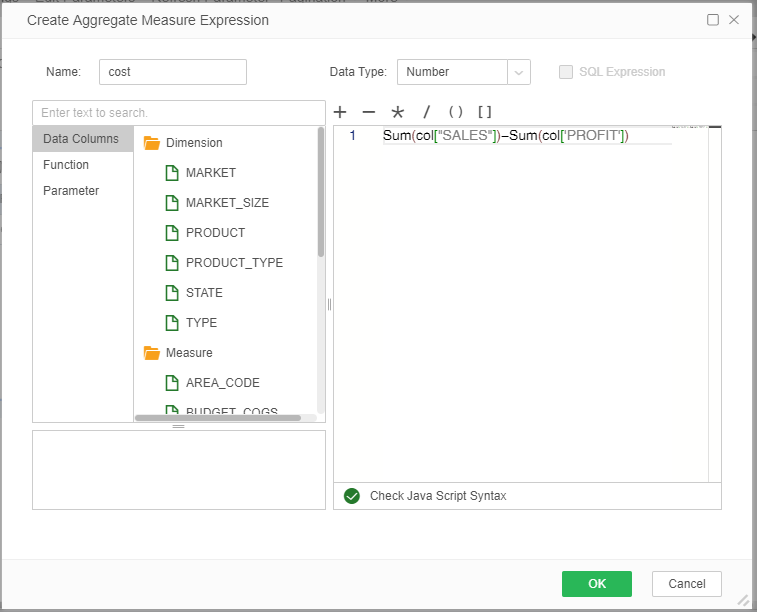
As shown in the following table, the scale data segment is implemented by creating a new aggregate expression.