|
<< Click to Display Table of Contents >> Population Standard Deviation |
  
|
|
<< Click to Display Table of Contents >> Population Standard Deviation |
|
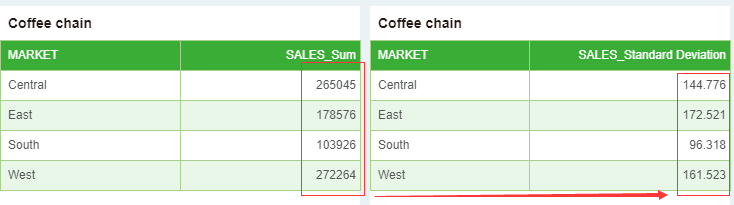
The overall standard deviation is the average deviation between the overall unit marker value and its arithmetic mean, which is the square root of the population variance. The user can modify the aggregation mode in the aggregation dialog box to the overall standard deviation. When the overall standard deviation is selected, the "and" option is not optional.
➢Example
Bind 2 columns "market" and "sales" to the table component. The aggregation mode of the column "sales" is set to the population standard deviation. The result is shown in the figure below. The overall standard deviation is the square root of the population variance.