|
<< Click to Display Table of Contents >> Waterfall Chart |
  
|
|
<< Click to Display Table of Contents >> Waterfall Chart |
|
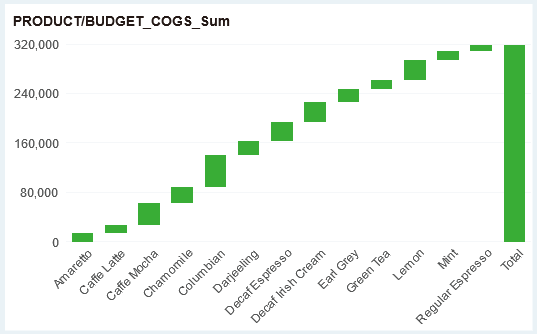
The waterfall chart shows the cumulative effect of the data and is finally summarized. When the user needs to adjust the size and color of the summarized column, it needs to be set by the corresponding attribute or format in the right panel of the column.