|
<< Click to Display Table of Contents >> Donut Chart |
  
|
|
<< Click to Display Table of Contents >> Donut Chart |
|
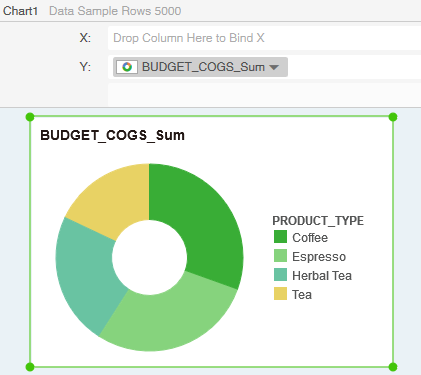
Donut charts can be drawn only if the bound metrics field in the X axis or the bound metrics field in the Y axis only. The data is displayed in the same way as a pie chart.