|
<< Click to Display Table of Contents >> How to Make a Waterfall Map |
  
|
|
<< Click to Display Table of Contents >> How to Make a Waterfall Map |
|
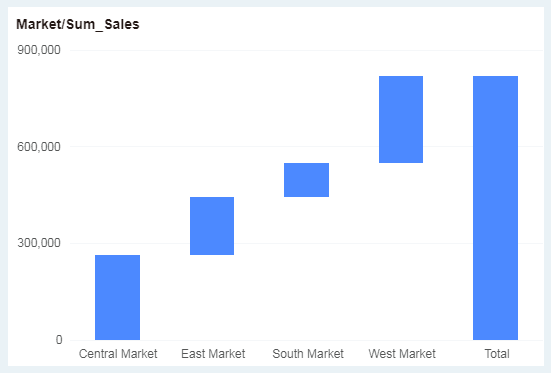
Waterfall charts show the cumulative effect of data and are summarized at the end. Take the sales revenue of the market as an example to show you how to make a waterfall chart.
1.Add Component
From the right Component pane, drag the waterfall chart ![]() to the editing area.
to the editing area.
2.Bind Data
In the left data list, drag the dimension "Market" to the X axis and drag the measure "Sales" to the Y axis.
Finally get the following waterfall chart.