|
<< Click to Display Table of Contents >> Bound Page And data Set Resource Tree |
  
|
|
<< Click to Display Table of Contents >> Bound Page And data Set Resource Tree |
|
The function of the binding window is to bind data and components. In the dashboard editing interface, the user performs binding operations on the components, and the binding window floats in the dashboard editing area and receives various data on the dataset resource tree. When you open the DB, the default is to directly enter the edit binding mode. After the component is placed, the focus falls on the component and enters the binding data interface at the same time.
❖Bound physical table
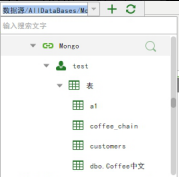
When binding data, you can use the physical table (Table) or view (View) in the data source to bind on the data set resource tree. For NoSQL data sources, such as Mongo, you can also directly select tables for binding.
Bind the table in the Mongo data source as shown in the following figure:
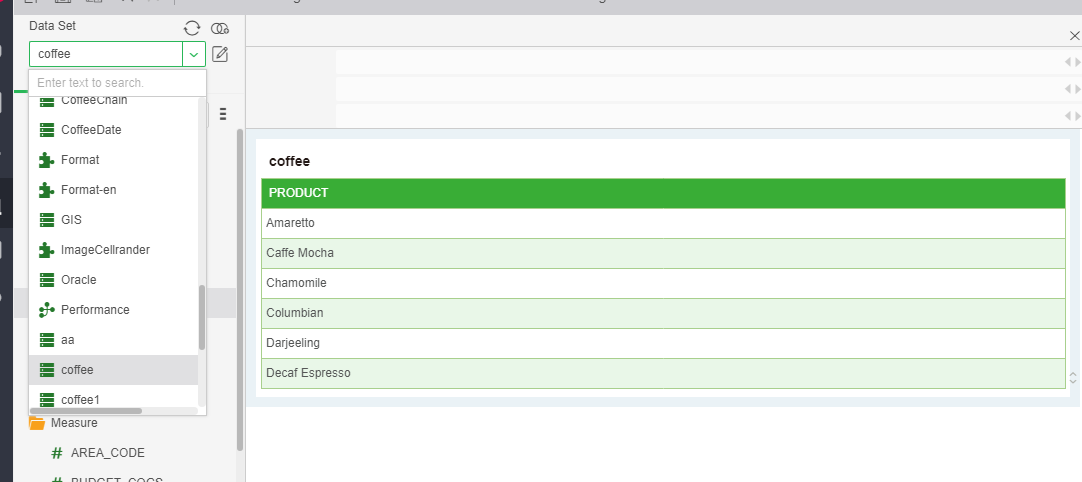
❖Bound data set
You can also select data sets for binding.
[Add Dataset] Click the Add Dataset icon to open the dashboard query. You can create a new combined query and save it in the Dashboard folder. You will not see it when you create the dataset.
[Refresh] Columns in the data set have been added, deleted, and changed. After the refresh, they can be synchronized.
[Edit Data Set] Click the edit data set icon to open the bound data set directly in the “Create Data Set” module or “Create Report” module.
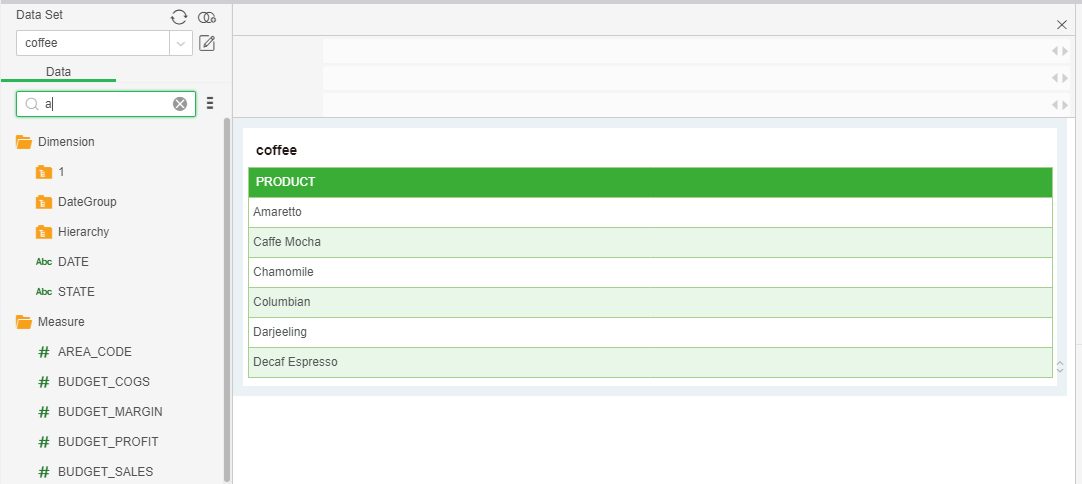
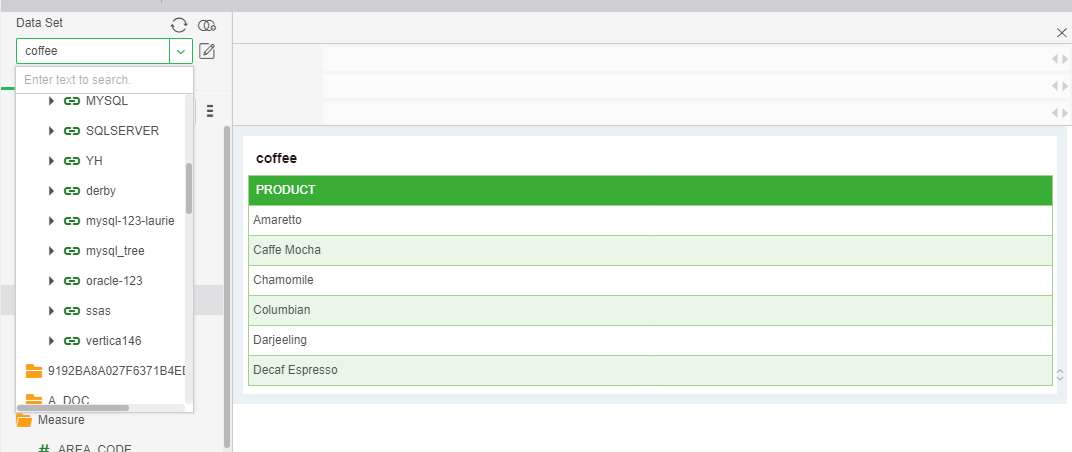
For data sets, dashboards, and data segments, you can use the search function to quickly find the resources you need.
Searchable location of dataset: dataset list of data connection interface, dropdown list of dataset in dashboard, added dataset, list of specified dataset, list of replaced dataset, list of dataset in edit parameter dialog box, report The data source data set list in the parameters, and the resource list of the export resource interface.
Dashboard searchable location: edit dashboard resource tree in reporting interface, dashboard list in hyperlink dialog box, view dashboard resource tree when report is displayed in tree, dashboard list of system monitoring interface, export resource interface Resource list, the dashboard resource tree of the portal customization interface.
Searchable locations of data segments: Dataset Resource Tree in the Edit Reports interface, Dataset Resource Tree in Advanced Sequencing, and Dataset Resource Tree in the Bindings dialog box for Freestyle Lists.
As shown in the figure below, the user drags and drags the data segment that needs to be statistically analyzed into the binding window. At the same time, the binder window binds the number of sample rows of the data set with gray font hints. The number of sample lines means: the maximum number of lines that can be edited in the edit report. If the setting for the number of sample rows is greater than the actual data in the data set, the number of editable rows is the total number of rows in the data set. The modification of the number of sample rows needs to be modified in the connection data - metadata interface of the data set - number of sample lines.