|
<< Click to Display Table of Contents >> R Graphics |
  
|
|
<< Click to Display Table of Contents >> R Graphics |
|
The R Graphics node can only connect to the R model node. The input script displays the R model data as a graph.
Connect an R model node, enter the script, select the R Graphics node settings and display area contains two pages: configuration items, results display.
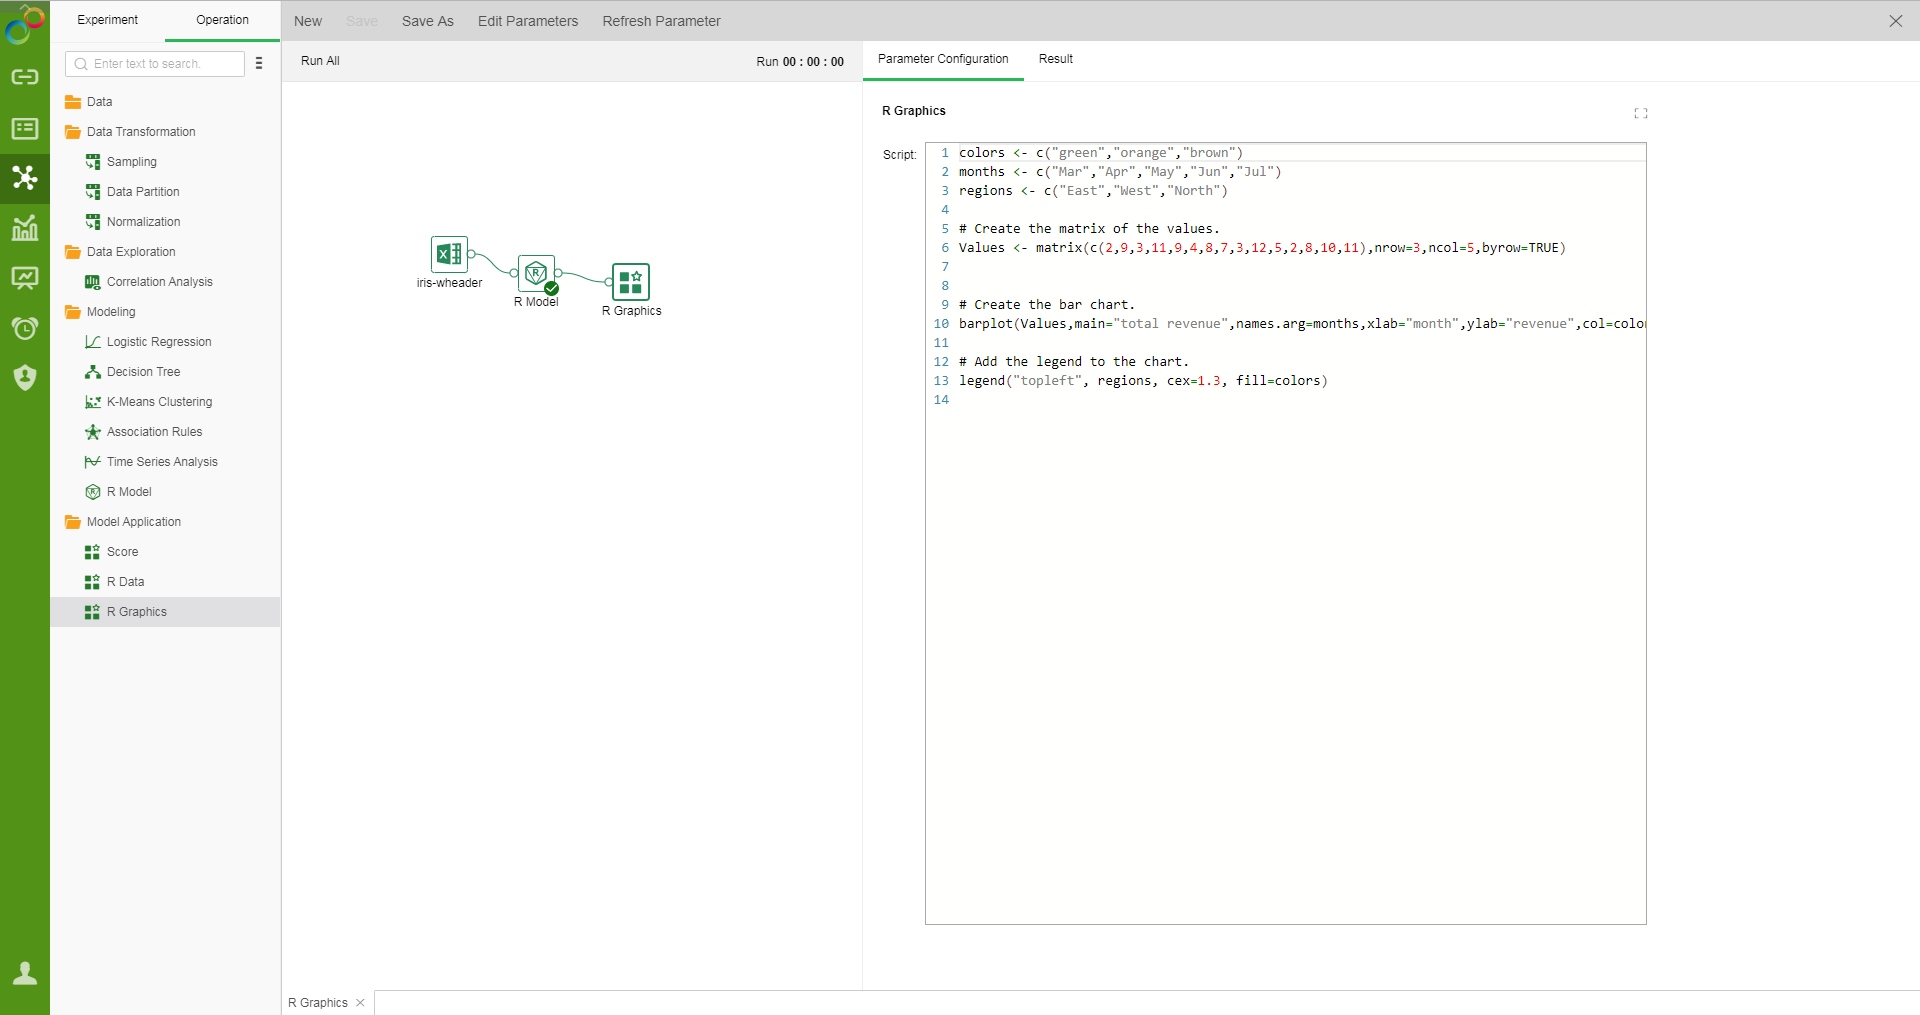
❖Configure R Graphics
Enter the script to reference the R model. The R Graphics can directly reference the MODEL variable. You can also reference the R script to draw.
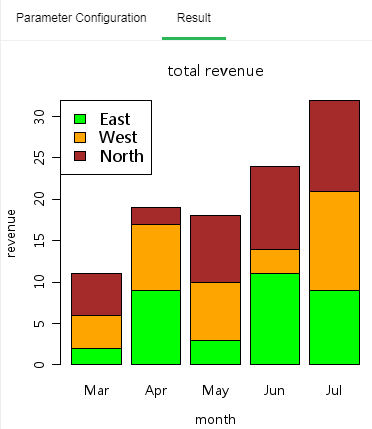
❖View R Graphics results
Show the results of the R model as a graph.
❖R Graphics node renaming
In the right-click menu of the R Graphics node, select "Rename" to rename the node.
❖Delete R Graphics node
In the right-click menu of the R Graphics node, select "Delete" or click the delete key on the keyboard to delete. You can delete the input and output connections of nodes and nodes.
❖Refresh R plot Graphics
In the right-click menu of the R plot node, select "Refresh" to update the synchronization data or parameter information.