|
<< Click to Display Table of Contents >> Dependency Analysis |
  
|
|
<< Click to Display Table of Contents >> Dependency Analysis |
|
The blood analysis function can easily and intuitively view the data source information used in the prepared report, and all types of data sources will be displayed in a similar organization chart. Blood analysis can be used on the Edit Report page and View Report page. The following two aspects will introduce the Yonghong blood relationship analysis function.
❖Editor Dashboard page
The report page can view the data blood information of the completed report. The blood analysis page has two entries, namely the More button of the edit report Tree and the More button of the single dashboard, as shown in Figure 1 and Figure 2 respectively.
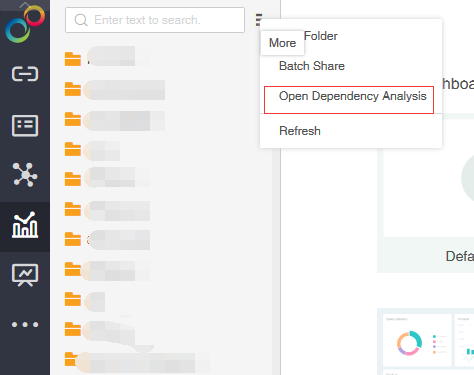
Figure 1
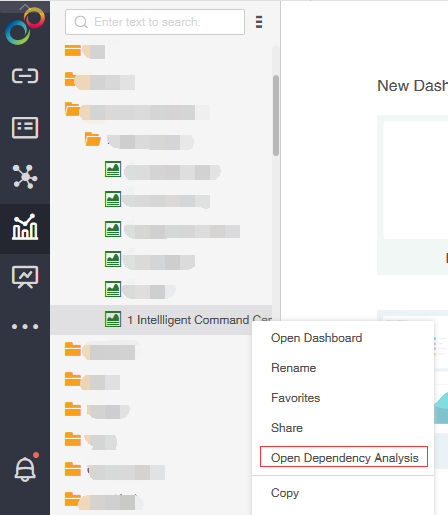
Figure 2
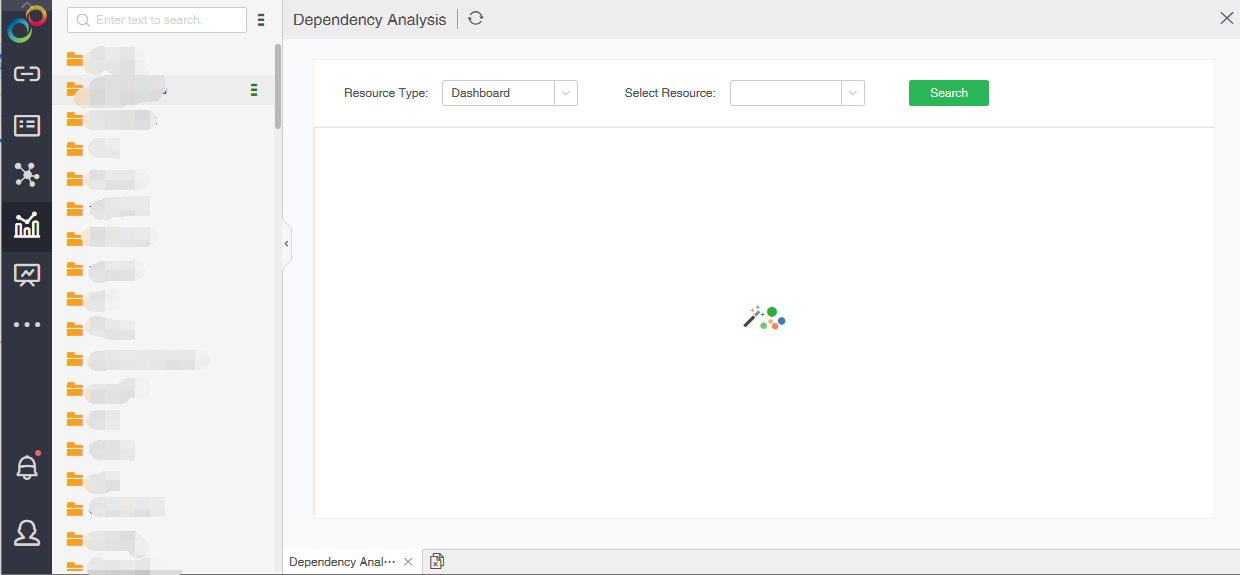
If you click on the "Open Blood Analysis" button on the dashboard tree, the initial blood analysis page is displayed on the right, as shown below:
If you click on the More button of a single dashboard and then open the blood analysis page, the blood analysis results of the selected dashboard will be displayed, as shown below:
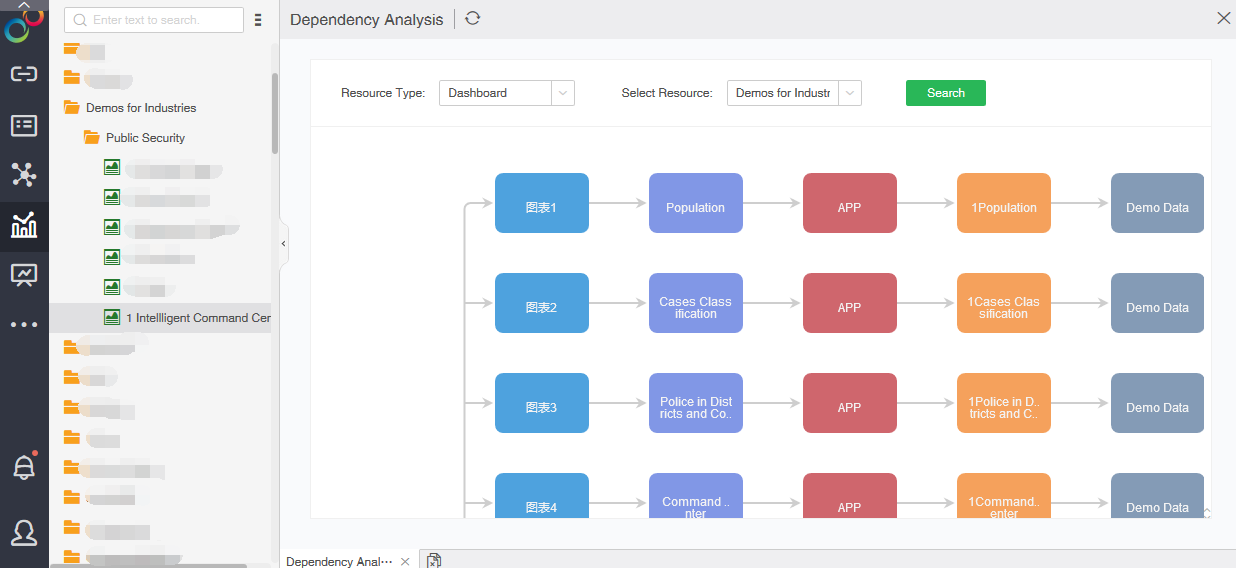
The blood analysis page can perform some operations to view the blood relationship analysis, which is implemented by the buttons on the page. The page parameters are as follows:
•Resource type: drop-down selection box, you can select the type of blood analysis resource to be viewed. Currently, there is only one type of “dashboard”, and other types will be added later.
•Select resources: According to the selected resource type, list the matching resources, currently display all dashboards, select the dashboard to view through the drop-down list.
•Query: After the resource is selected, click the Query button to query the bloodline analysis result of the resource.
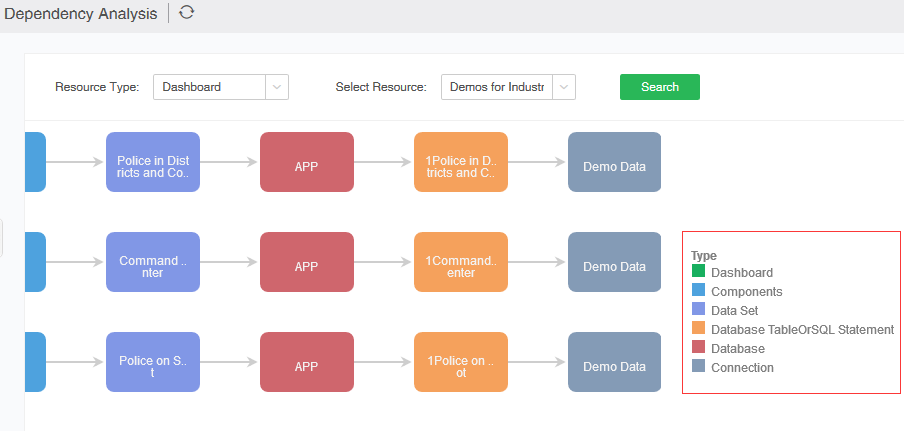
The blood analysis page, different types of nodes, will be distinguished by color, as shown below:
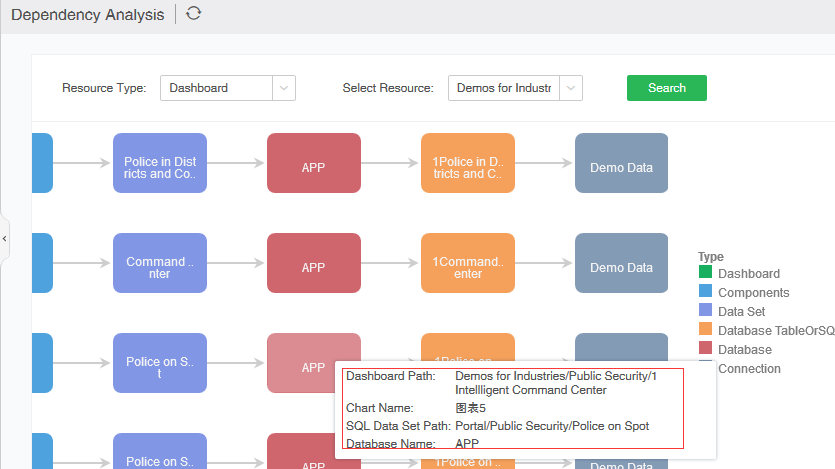
The mouse is hovering over the node of the blood analysis, and the details of the current node are displayed, as shown in the following figure:
❖View dashboard page
View the dashboard page to view the results of the blood relationship analysis. If the view dashboard selects the tree mode, you can view the blood relationship analysis by clicking the More button on the dashboard tree and the More button of the single dashboard. This part is similar to the edit dashboard. I will not repeat the introduction.
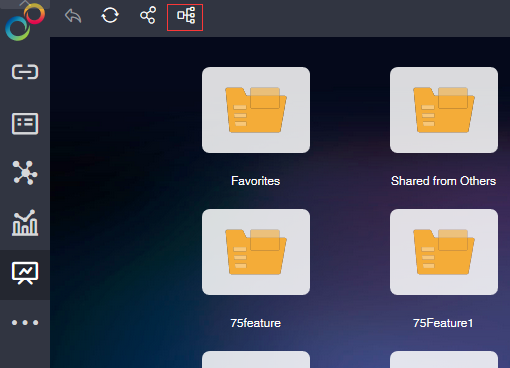
If the view dashboard is in icon mode, you can open the dependency analysis page by clicking the dependency analysis button on the toolbar, as shown below: